


By Eric Ting, SFGATE
Updated
-

Nurses rush to meet with a patient that his being admitted to the emergency room at Regional Medical Center on May 21, 2020 in San Jose, California.
Nurses rush to meet with a patient that his being admitted to the emergency room at Regional Medical Center on May 21, 2020 in San Jose, California.
Photo: Justin Sullivan/Getty Images
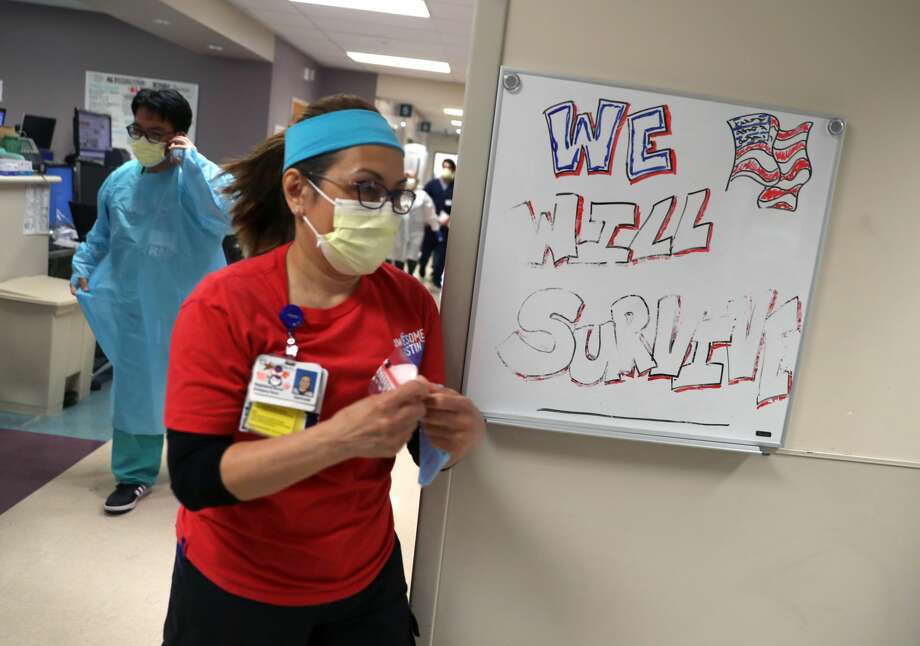
Photo: Justin Sullivan/Getty Images
Nurses rush to meet with a patient that his being admitted to the emergency room at Regional Medical Center on May 21, 2020 in San Jose, California.
Nurses rush to meet with a patient that his being admitted to the emergency room at Regional Medical Center on May 21, 2020 in San Jose, California.
Photo: Justin Sullivan/Getty Images
The number of confirmed COVID-19 cases in the San Francisco Bay Area continues to climb, and in some counties, the case count has accelerated or “spiked” over the past two weeks.
While the rising case numbers have been a source of worry for some, case counts alone are not the best metric for measuring spread.
“The easiest thing to look at is case counts, which is not a perfect metric since you have to factor in increased testing,” UCSF epidemiologist Dr. George Rutherford told SFGATE earlier this week. “We’re finding more asymptomatic cases now, so it’s not exactly comparable to March and April, when most detected cases were symptomatic. Now in May and June, we’re catching more asymptomatic cases so it can be hard to interpret since we’re finding more infections.”
Rutherford believes that up to 60% of infections are either asymptomatic or so mild an individual does not think to get tested — which means that increased testing will yield more confirmed cases if you expand testing to be available to anyone regardless of symptoms. Because of enhanced testing capabilities, Rutherford believes hospitalizations and percent positivity of tests are the best metrics to use when measuring spread.
Here’s where the nine Bay Area counties stand on hospitalizations and percent positive test rates when using data from May 25 to June 8. May 25 is the Monday of the week case increases started to accelerate, and there is typically a one-to-two week lag between infection and hospitalization. All data comes from individual county websites and the state’s database for county-by-county hospitalizations.
San Francisco (2,809 confirmed cases)
Seven-day average for hospitalizations on May 25: 56.6 patients
Seven-day average for hospitalizations on June 8: 39 patients
Seven-day average for percent positive test rate on May 25: 2.9 percent
Seven-day average for percent positive test rate on June 8: 1.6 percent
San Mateo (2,475 confirmed cases)
Seven-day average for hospitalizations on May 25: 60.9 patients
Seven-day average for hospitalizations on June 8: 55.1 patients
Seven-day average for percent positive test rate on May 25: 4.6 percent
Seven-day average for percent positive test rate on June 8: 3.5 percent
Alameda (4,033 confirmed cases)
Seven-day average for hospitalizations on May 25: 82.7 patients
Seven-day average for hospitalizations on June 8: 87.4 patients
NOTE: Alameda does not report the daily percent positive test rate, only cumulative testing data.
Contra Costa (1,798 confirmed cases)
Seven-day average for hospitalizations on May 25: 13 patients
Seven-day average for hospitalizations on June 8: 17 patients
Seven-day average for percent positive test rate on May 25: 2 percent
Seven-day average for percent positive test rate on June 8: 4.7 percent
Santa Clara (3,017 confirmed cases)
Seven-day average for hospitalizations on May 25: 72.9 patients
Seven-day average for hospitalizations on June 8: 65.6 patients
Seven-day average for percent positive test rate on May 25: 1.2 percent
Seven-day average for percent positive test rate on June 8: 1.5 percent
Marin (635 confirmed cases)
Seven-day average for hospitalizations on May 25: 3.1 patients
Seven-day average for hospitalizations on June 8: 1.7 patients
Seven-day average for percent positive test rate on May 25: 4.2 percent
Seven-day average for percent positive test rate on June 5*: 4.5 percent
*Marin County’s testing data only goes up to June 5.
Solano (610 confirmed cases)
Seven-day average for hospitalizations on May 25: 42.9 patients
Seven-day average for hospitalizations on June 8: 29.3 patients
NOTE: Solano does not report the daily percent positive test rate, only cumulative testing data.
Napa (157 confirmed cases)
Seven-day average for hospitalizations on May 25: 2.1 patients
Seven-day average for hospitalizations on June 8: 2.7 patients
NOTE: Napa does not report the daily percent positive test rate, only cumulative testing data.
Sonoma (671 confirmed cases)
Seven-day average for hospitalizations on May 25: 13.4 patients
Seven-day average for hospitalizations on June 8: 13.6 patients
NOTE: Sonoma does not report the daily percent positive test rate.
The only Bay Area county that saw a confirmed increase in both hospitalizations and the percentage of positive tests is Contra Costa County, but both increases are marginal at best when compared to other areas in the country seeing a rebound in infections. One such example is Arizona, where the percent positive test rate has increased from nine percent on May 24 to 25 percent on June 7.
MORE CORONAVIRUS COVERAGE:
Sign up for ‘The Daily’ newsletter for the latest on coronavirus here.
- San Francisco restaurants given go-ahead to reopen sit-down dining
- How long will it take to gauge the impact of George Floyd protests on coronavirus spread
- Coronavirus updates: Monterey County welcomes back tourism Friday
- One of the Bay Area’s only Cambodian restaurants will permanently close after 30 years
- A husband and wife were both nurses. They thought they would get through the crisis. Then, he died.
Eric Ting is an SFGATE digital reporter. Email: [email protected] | Twitter:@_ericting


